 Learning Center
Learning Center
Learning Center
Once you've registered for Ragic, you're ready to start building your database. This article serves as your learning map, guiding you through each key step with linked courses along the way. Follow the path to build a fully functional database for your team and learn how to make the most of your data.
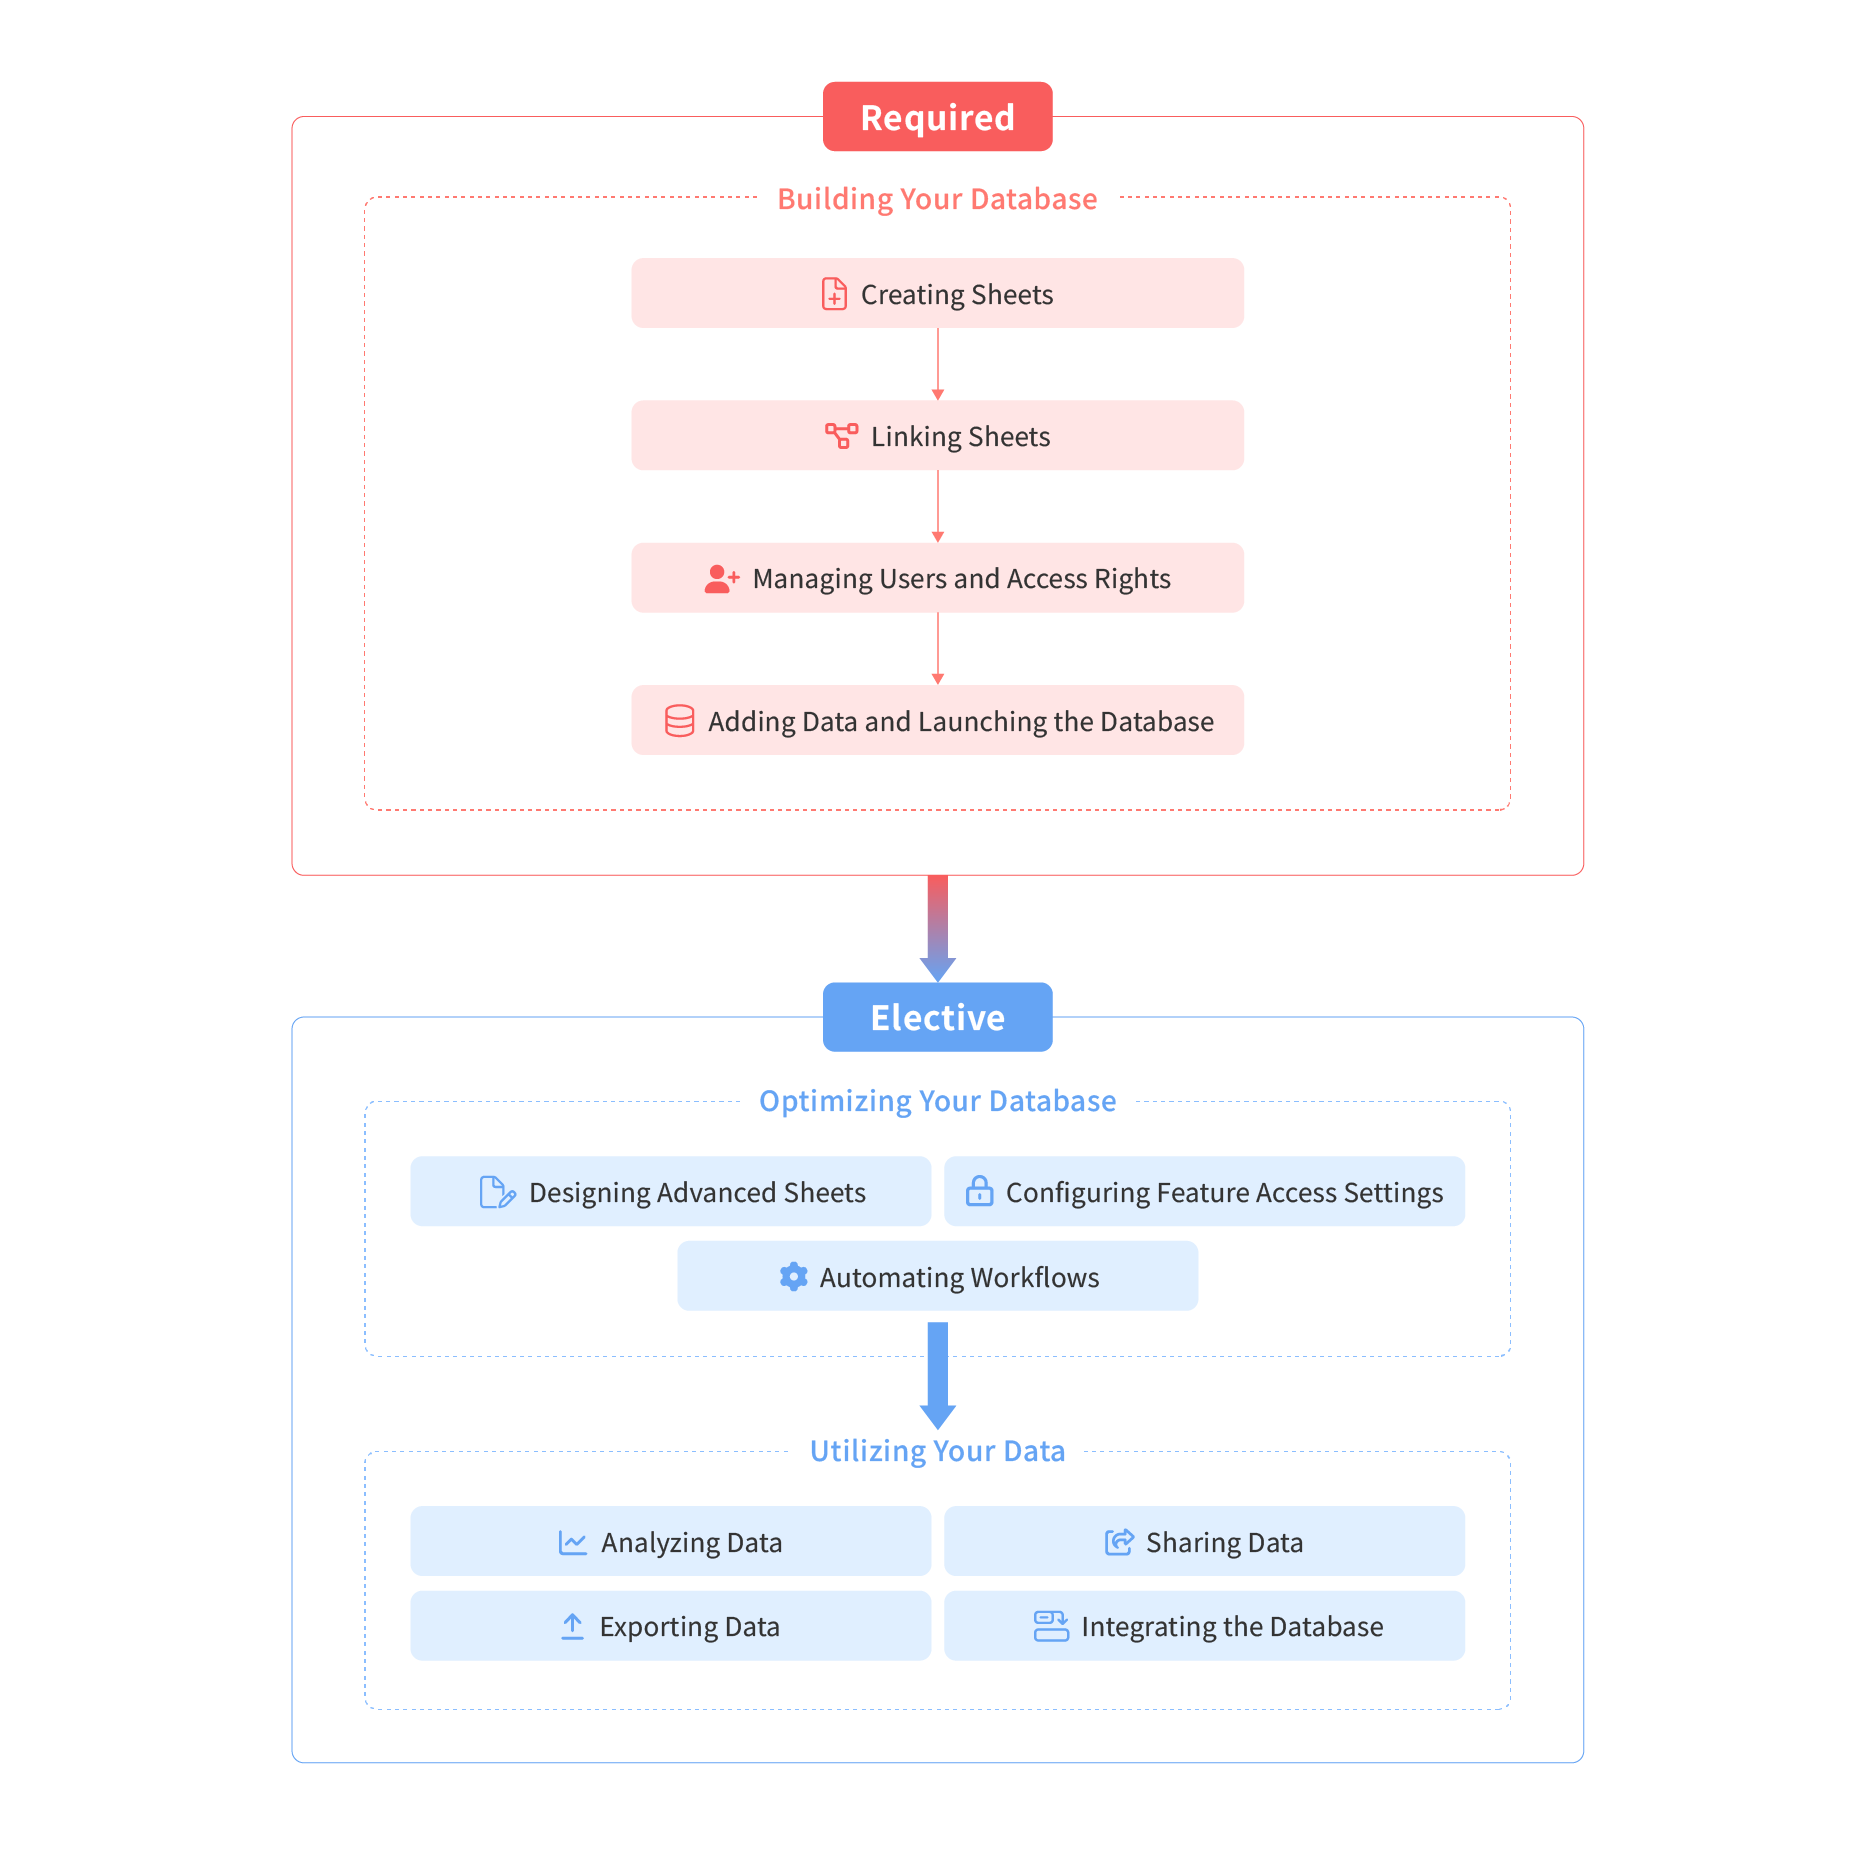
Sheets are the foundation of your database, so the first step is designing sheets that fit your needs. Before diving in, take some time to understand Ragic's core concepts and plan your structure. Here are the courses for this stage.
After creating multiple sheets, learn how to Create Relationships Between Sheets with Link and Load, keeping data in sync across sheets, avoiding duplicate entry, and achieving a level of data consistency that paper forms and Excel simply can't match.
With your sheets ready, it's time to invite your team. Check out Inviting Team Members & Setting Access Rights to learn how to add users, create groups, and configure access rights.
With everything set up, you're ready to start entering data and launch your database. Here are some courses to help you along the way.
One of Ragic's key strengths is the ability to adjust your sheet design at any time. Even if you discover issues after going live, you can always make changes and keep improving. Here are some courses to help you take your database further.
Once your basic sheets are in place, you can refine their appearance or use more advanced linking features to make your database more flexible.
Beyond basic access rights, you can control which system features each user group can use. Learn how to Manage Feature Access Settings to restrict or grant access to specific features for each group.
After your database is live, you can add automation to streamline day-to-day operations.
Once you've collected enough data, it's time to put it to work. Use your data for analysis, sharing, export, and integration with other systems to support better decisions and collaboration. Here are the courses to get you started.
After collecting data over time, learn how to Create Reports to run statistical analyses and get a clear picture of your operations.
Learn how to Share Sheets and Records with clients or partners who don't have a Ragic account, or embed your sheets into a website so external users can fill in data directly.
Learn how to Export Data to Excel, CSV, or PDF, and use Custom Print Reports or Mail Merge to output data in a customized document format.
Explore Integrating Your Database to link Ragic with other systems using built-in tools or no-code platforms.
For more detailed documentation on features and settings, refer to the Design Guide.
You can also share the User Guide with your team members to help them get up to speed quickly.
 Thank you for your valuable feedback!